
In the previous article I compared CTA-2034, the standard behind the spinorama, with 300 simulated living rooms. Its 70 measurements look in the right directions, but the Predicted In-Room Response gives the first reflections four times the weight they have in a room, and its averages hide the notches a crossover digs into each reflection.
Here is how I would read the same measurements. I kept the two circles on purpose. Measuring the whole sphere takes a robot or a near-field scanner, while two circles take a turntable, and that is why so many spinoramas get published.
So that the proposal is not tuned to one loudspeaker, I tested it on seven: the two-way of the first study with a plain dome and with a waveguide, a coaxial two-way, a two-way MTM (a tweeter between two woofers), a horizontal three-way monitor with the woofer beside the midrange and the tweeter, a three-way tower and a four-way tower standing on the floor. Each one gets the four crossovers of the first study (LR2, LR4, LR8 and brickwall FIR) and goes into the same 300 rooms. A tower is not small compared with the listening distance, so every path is taken from each driver's own position, with its own direction and length.
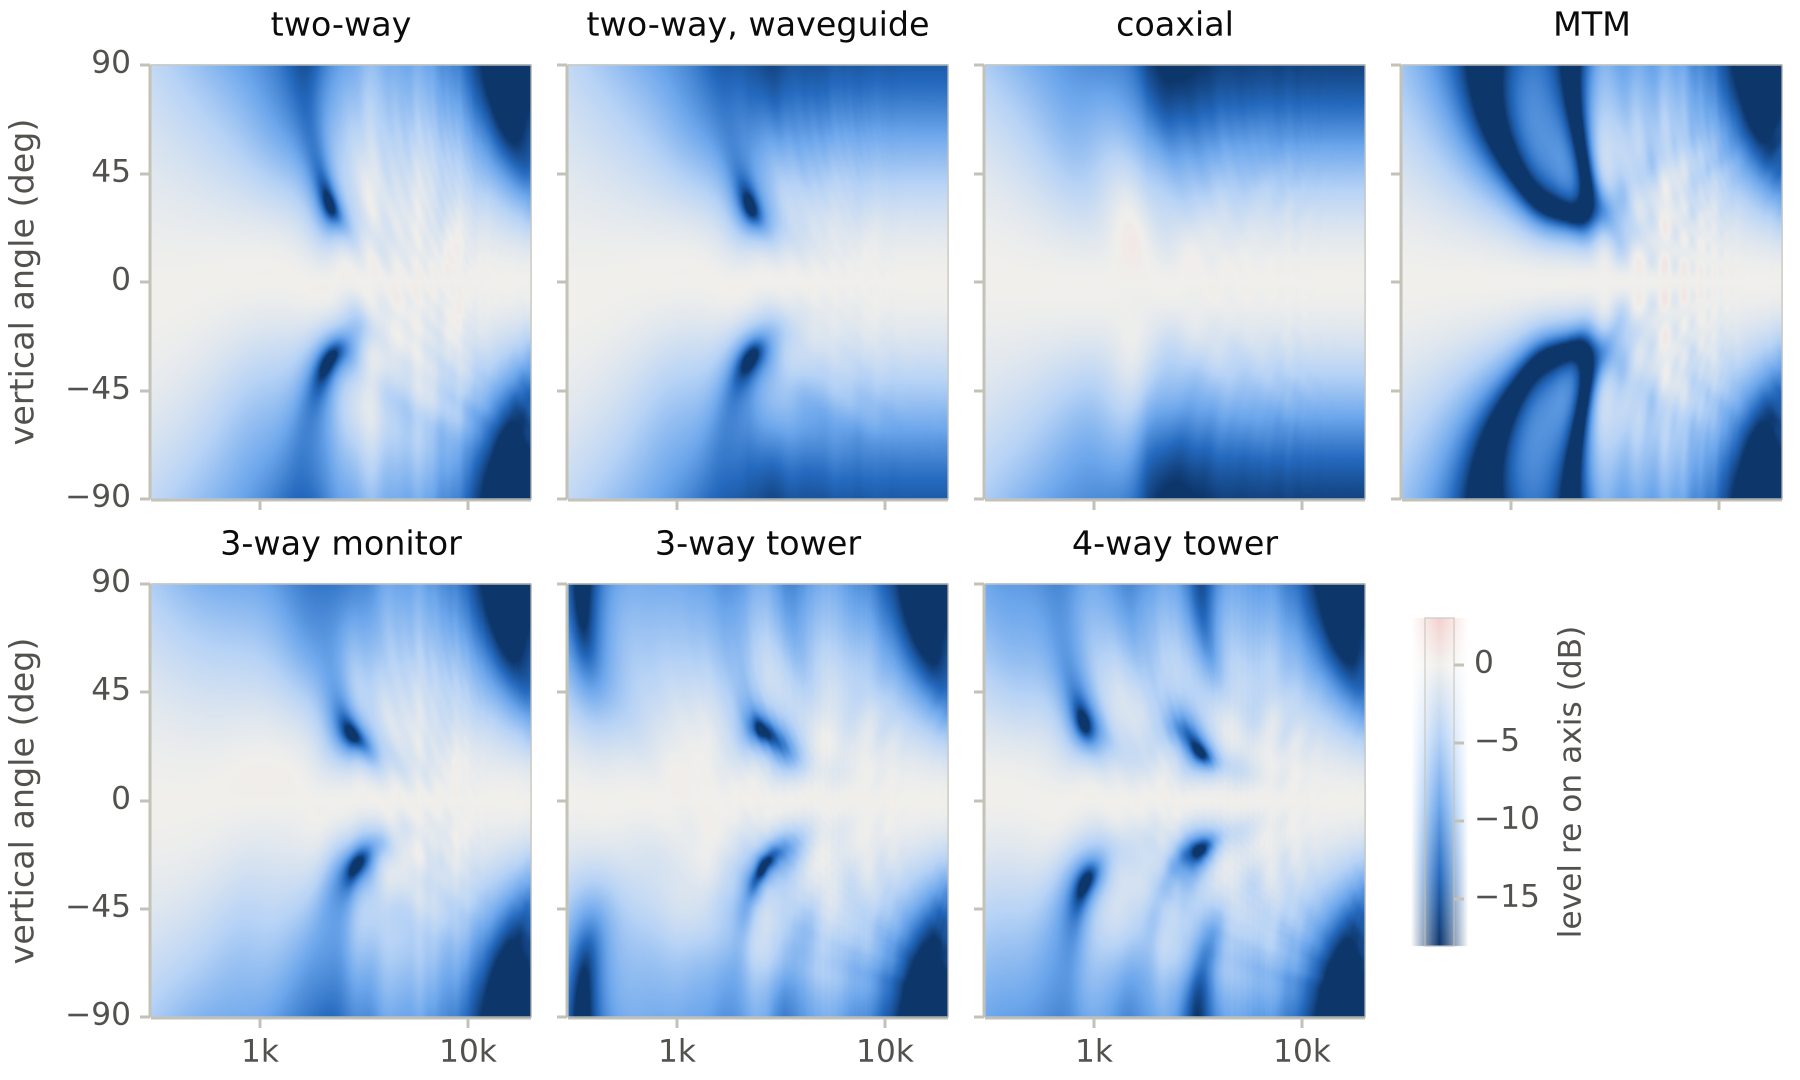
Their vertical directivity, all with LR4 crossovers, shows how different they are. The coaxial has no lobe at all, since its two drivers share one centre. The MTM's woofers, 230 mm apart, open a pair of wide lobes of their own below the crossover. The towers lobe at each of their crossovers.
The sound power, driver by driver
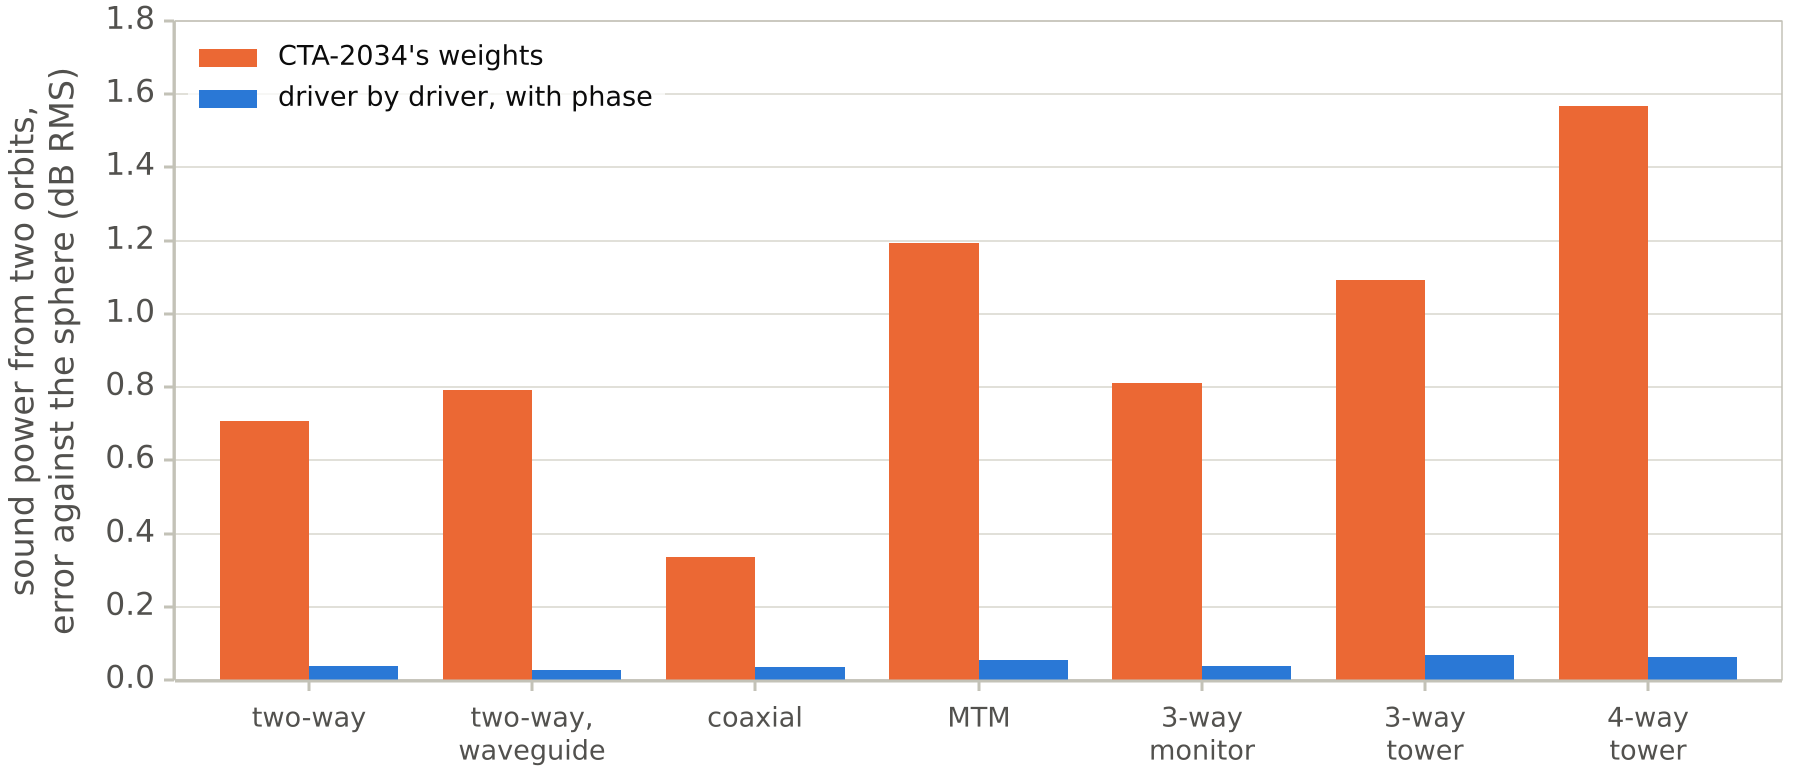
The standard estimates the sound power by weighting the 70 directions. Where the drivers interfere, the energy lost to the cancellation lies between the two circles, and no weighting of the circles can find it. Across the seven loudspeakers the estimate is 0.34 to 1.57 dB RMS off for the worst crossover of each, and up to 3.2 dB at some frequencies for the MTM.
Each driver on its own radiates smoothly, though. Measured alone and with its phase, on the same two circles, a driver's response can be interpolated over the whole sphere. The drivers are then added with their positions on the baffle, which puts the cancellation back where it happens, and the error falls to 0.03 to 0.07 dB.
This needs each way to be driven on its own. Any active loudspeaker allows it, and any manufacturer can measure the drivers before the passive crossover goes in. For a finished passive loudspeaker measured as a whole, the standard's estimate remains the only option, and the published curve should say which one it is.
A curve that matches the rooms
In a room most of the energy that reaches the listener has bounced several times, so the room behaves mostly as a sound power meter, with the direct sound adding a little forward weight. Fitted to the rooms, the best combination is 0.13 LW + 0.94 SP, with a slightly negative weight for the Early Reflections, and leaving each loudspeaker out of the fit in turn barely moves these numbers. Rounded to 0.1 LW + 0.9 SP, it predicts the steady-state response of 150 test rooms within 0.4 to 0.8 dB RMS, where the PIR is 1.7 to 2.9 dB off.
For the early sound, the direct sound and the first reflections, which carry most of what we hear of the loudspeaker itself, the fit gives about 0.4 LW + 0.4 ER + 0.2 SP. It predicts the rooms within 0.4 to 0.8 dB, against 1.5 to 2.3 dB for the PIR.
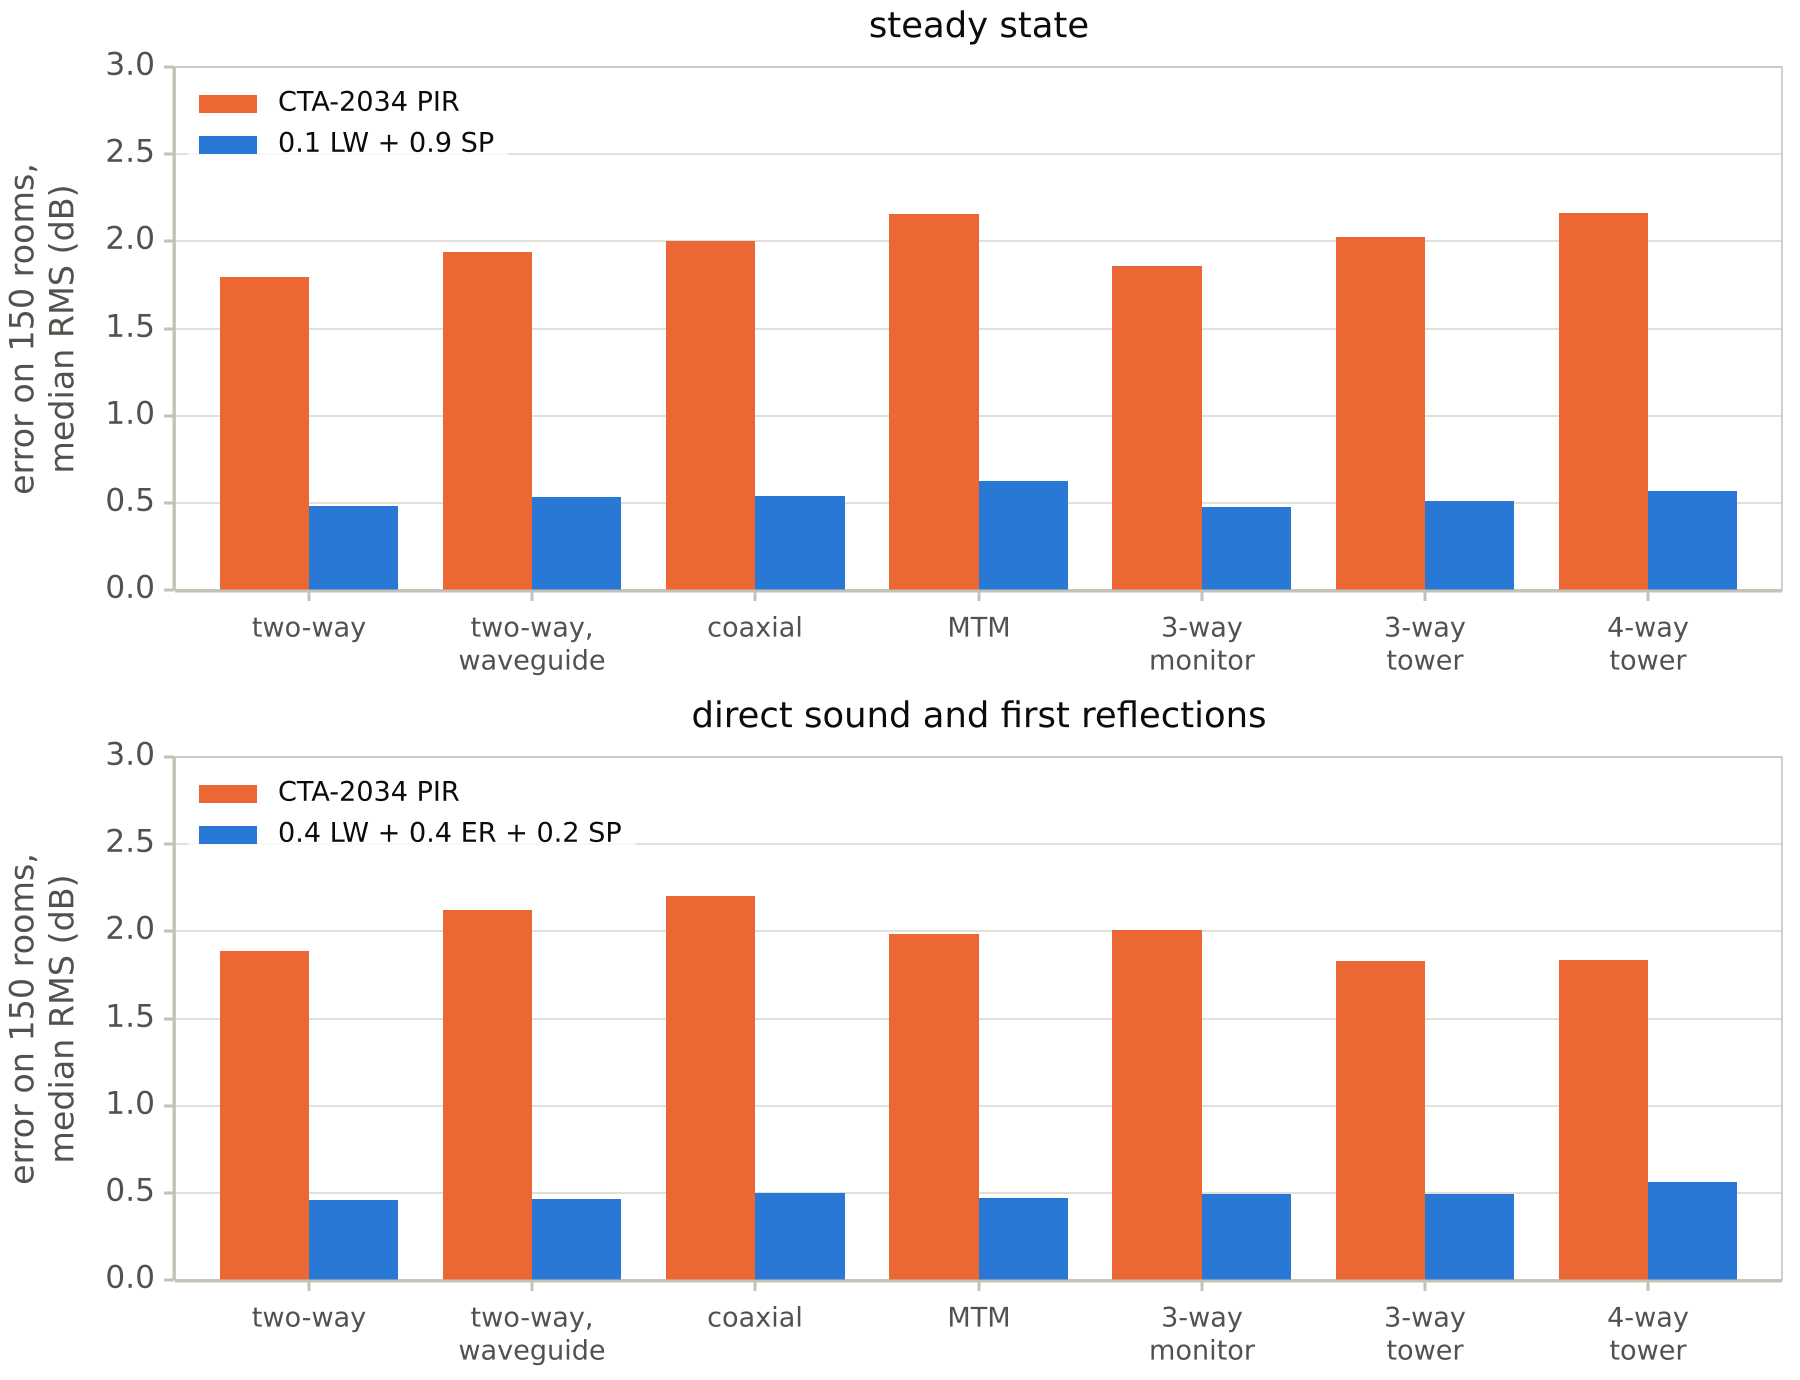
The weights matter more than the sound power estimate. With the sound power rebuilt driver by driver but the PIR's weights, the error stays at 1.6 to 2.6 dB. With the new weights and the standard's sound power, it rises to 1.5 dB for the loudspeakers whose drivers lobe the most.
The colouration of the reflections, one direction at a time
The Early Reflections curve looks in the right directions, and the averaging is what hides what each reflection carries. The proposal keeps the same directions and reads them one by one.
For each direction I take the roughness of its response, which is how far the response deviates from itself smoothed over an octave, from 200 Hz to 10 kHz. A gentle tilt or a change of level leaves it at zero, while a notch or a peak narrower than an octave raises it, wherever the crossovers are. The roughness of each direction is then weighted by the share of energy its reflection brings in a room (16 % for the floor, 26 % for the ceiling, 30 % for the side walls, 7 % for the wall the loudspeaker faces and 21 % for the wall behind it, from the 300 rooms) and by how much the loudspeaker radiates in that direction.
Across the 28 combinations of loudspeaker and crossover, this index follows the colouration of the first reflections in the rooms with a correlation of 0.97. The roughness of the Early Reflections curve itself reaches only 0.56. Like the path-by-path reading of the previous article, the index describes what the loudspeaker sends into the reflections. The correlation shows that the two circles hold that information. Whether it predicts the colouration a listener hears is a question for listening tests.
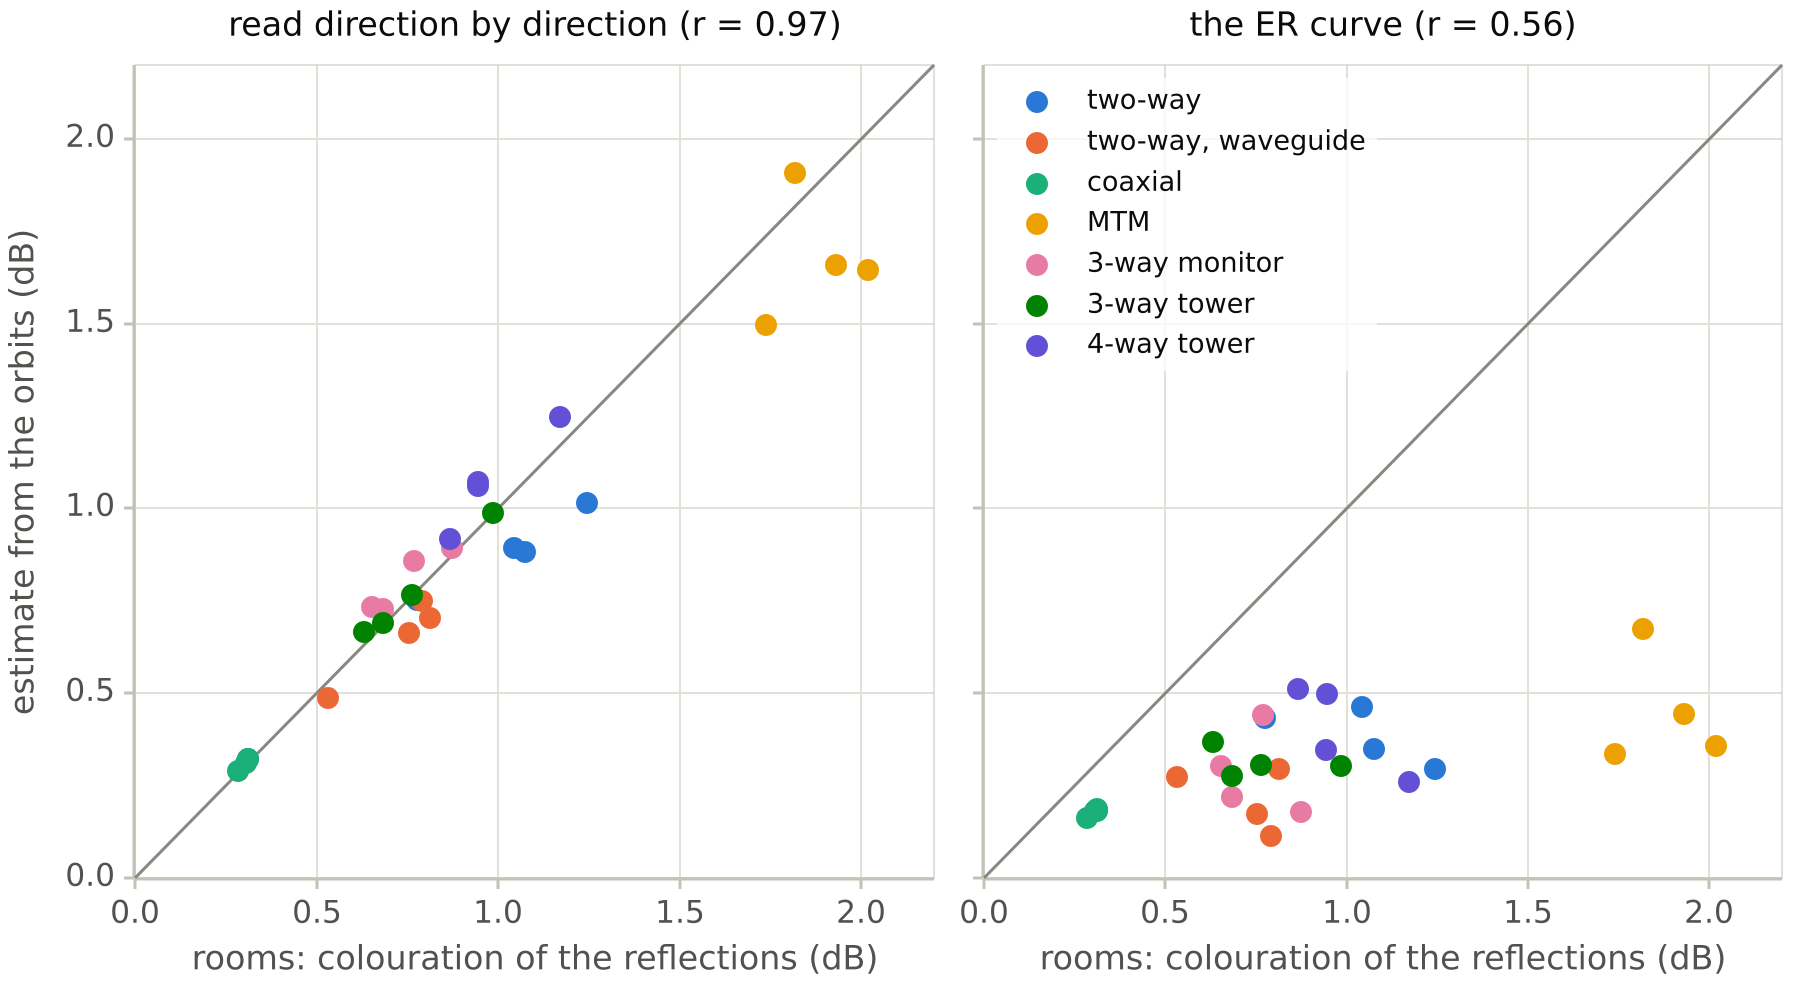
The index also catches the cases where a steep crossover does not help. In the MTM the two woofers interfere with each other below the crossover, and a brickwall filter lets them play right up to it. In the three-way monitor the midrange dome beams above 2 kHz while the tweeter does not, and the brickwall turns the crossover into an abrupt step of directivity. The rooms and the index agree on both.
The proposal
- Measure the two circles as today, way by way and with phase when the ways can be driven separately.
- Rebuild the sound power over the sphere driver by driver.
- Predict the in-room response with 0.1 LW + 0.9 SP, and the early sound with 0.4 LW + 0.4 ER + 0.2 SP.
- Publish the colouration index of the reflections next to the curves, along with the responses of the reflection directions themselves, as a description of the loudspeaker until listening tests say how much of it is heard.
None of this needs a new measurement rig. It needs the per-way data that manufacturers and active loudspeakers already have, and another way of combining it.
Limits
These are simulations, with one geometry per family, rectangular rooms and the paths added in energy. They show that the two circles hold the information, and the numbers will move with measured loudspeakers. For towers, anything built on far-field measurements is off by 0.2 to 0.3 dB in steady state and 0.6 to 0.7 dB in the early sound at a normal listening distance, whatever the weights. The colouration index is a physical measure, and whether the colouration of a reflection is audible, and how much, is a question for listening tests, which I have not run.
I don't expect a standard to change because of a blog post. The code, the data and the full report are on GitHub, where section 7 covers this proposal, and anyone who wants to check it, break it or try it on measured loudspeakers is welcome to.
I did this study with Claude, Anthropic's AI model, as a working partner. It wrote most of the code, ran the simulations and drafted the report and these articles; I set the questions and checked the results. Everything is public, so anyone can rerun it.